 |
Shadows from Higher Dimensions
|
Ivars Peterson
SHADOWS AND SLICES
Venturing into the fourth dimension can be as dramatic and rewarding as seeing
the earth from space for the first time. The view from a higher dimension
reveals features and patterns barely noticeable within the lower-dimensional
world itself. A truly global picture emerges. Human beings, living in a
three-dimensional world, easily recognize the triangles, squares, and other
polygons of Flatland, whereas Flatlanders see only lines. In the same way,
it takes a view from the fourth or a higher dimension to catch glimpses of
the true nature of three-dimensional objects and to see their relationships
to one another.
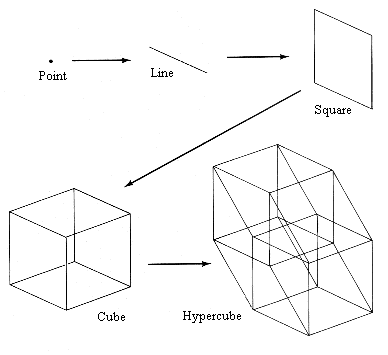
The mathematical journey into the fourth dimension
starts with a point-a zero-dimensional object having no length, breadth,
or height. A point stretches into a line, which in turn sweeps out a square,
which then balloons into a cube. Once a line forms, at each succeeding stage,
the figure expands In a new direction at right angles to those directions
already defined. Each step takes the figure into a higher dimension. Adding
a fourth direction at right angles to the other three sweeps a cube into
the fourth dimension (see Figure 4.3). The result is a hypercube.
 |
| FIGURE 4.3 A line forms when a point is extended in a particular direction. shifting the line at right angles to its length generates a square, whereas moving the square at right angles to its plane produces a cube. Moving the cube at right angles to all three previously defined directions creates a hypercube. |
What does a hypercube, or for that matter any other four-dimensional object,
look like? One way to keep track of a multidimensional geometric figure is
to use a coordinate system to locate the collection of points that make up
the object. It takes a single number to specify the position of a point in
one-dimensional space, just as a roadside signpost marks the distance from
a certain town. Two numbers locate a spot in two dimensions. On the earth's
two-dimensional, but curved, surface, longitude and latitude pin down any
location. Similarly, x and y coordinates - a pair of numbers - can be used
to specify each corner of a square drawn on a piece of paper. In three
dimensions, everything is located by three numbers. Hence, a flight over
the earth's surface requires an additional, third dimension -the altitude.
Logically, four numbers or coordinates must then represent a point in four
dimensions; five coordinates, a point in five-dimensional space; and so on.
However, most mathematicians need no pictures to step into higher-dimensional
mathematical structures. They have long been able to
deal abstractly with multidimensional problems
by treating the concept of dimension more as a mathematical filing cabinet
than as a direction in geometric space. Each filing folder in the cabinet
represents a dimension in which all the information about one particular
variable can be collected and stored. Problem solving and theorem proving
are essentially manipulations, according to specific rules, of the numbers
and symbols in these folders.
In fact, any set of four numbers, variables, or parameters can be considered
either as a four-dimensional entity or as a string of numbers that can be
filed or manipulated in certain ways. One of the most famous examples is
embedded in Albert Einstein's
theories
of special and general relativity. In these theories, three-dimensional
space and time together make up a four-dimensional continuum in which space
and time are intimately interconnected. Einstein's spacetime is only
one of many different types of four- dimensional spaces. A geologist may
study past climates by correlating latitude and longitude with the amount
of pollen found at various depths in bore holes drilled into the soil. The
four variables - longitude, latitude, amount, and
depth-add up to another kind of four-dimensional space.
Going beyond the fourth dimension is as easy as adding more variables. Some
physicists have proposed modifications to Einstein's view of the universe.
Their theories introduce seven or more dimensions
in the form of miniature hyperbubbles hanging from
each point of space-time. Applied mathematicians trying to solve the equations
that would allow a business to manufacture and distribute its products most
efficiently may deal with thousands of variables, from the cost of various
raw materials to the distances between cities.
The variables are nested in multidimensional spaces impossible to visualize.
A few mathematicians have over the years speculated about a fourth geometric,
or spatial, dimension. In 1827, August F.
Möbius noticed that the silhouette
of a left hand can be turned into the silhouette of a right hand by passing
the figure through the third dimension, one higher than the dimension of
the figure itself. Anyone can duplicate his mental feat by using a cutout
drawing of a hand. Picking up the cutout and flipping it upside down before
returning it to a table transforms the figure into its
mirror image. Perhaps,
Möbius ruminated, a four-dimensional
space would be needed to turn a three-dimensional,
left-handed glove into a right-handed one.
Later in the nineteenth century, several scholars, including American
mathematician W. L. Stringham, studied and published drawings of four-dimensional
figures. Stringham's sketches in particular and the efforts of mathematician
C. H. Hinton, who believed that people could be trained to see a hypercube,
prompted a great deal of public interest. Even the prominent
mathematician Henri
Poincaré discussed the possibility of perceiving the fourth
dimension.
Until the computer came along, attempts to picture otherworldly objects like
the hypercube had limited success. Human beings had to cope with the same
kind of problem that "A Square" faced when he encountered a sphere in Flatland.
As "A Square" found, it's not easy to get a complete, meaningful view of
a higher-dimensional object.
One possible solution is to look at the object's shadow ; another is to picture
slices through its body. Shadows and slices provide two distinct sets of
views that reveal different kinds of information about a geometric object.
Consider the shadow cast by a three-dimensional chair. The chair is usually
recognizable from its two-dimensional shadow alone. Although the shadow exhibits
distorted lengths, skewed angles, and planes hidden by edges, it still preserves
the connections and relationships between the chair's legs, back, and seat.
In the same way, the purely mathematical operation of projection, akin to
casting a shadow, preserves a figure's continuity,
although the object's projection may be distorted.
Slices through an object provide a sequence of cross sections that preserve
the object's angles and lengths, although the relationships among parts of
the object may be ambiguous. For example, cutting along planes parallel to
the floor gives a varying picture of a chair. Near the floor, a slice through
the legs reveals four disconnected circles. Another slice may capture the
square seat; yet another, the thin rectangle of the back. The mind's eye
can reassemble these images into a picture of a chair.
A computer is able to manipulate and plot the four numbers or coordinates
that locate each point in a four-dimensional object. But because it can display
just two or three of the object's four dimensions, the viewer again sees
only shadows or slices of the object. Nevertheless, a computer's speed and
flexibility greatly extend the number and types of views of four-dimensional
objects at which a mathematician can look.
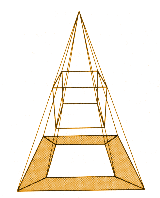
The shadows cast by an ordinary, three-dimensional cube, transparent except
at the edges, give some clues about what to expect from a hypercube. A cube's
two-dimensional shadow can resemble a square within a square (see Figure
4.4).
 |
 |
| FIGURE 4.4 A cube with opaque sides and a transparent
top and bottom casts a shadow that looks like a square within a square
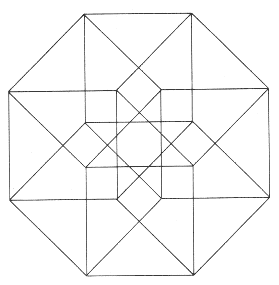
FIGURE 4.5(right) This view of a hypercube shows the figure's 16 vertices
and 32 edges |
Rotating the cube produces a hypnotizing geometric minuet as the shadow's
lines lengthen and contract and its squares diminish and expand. So, too,
a rotating hypercube springs to life in a movie pieced together from a sequence
of computer-generated images. At first, it may look like a square with 4
corners and 4 edges. That square turns out to be just one of 6 faces of a
cube, which appear as parallelograms, sharing a total of 12 edges and 8 vertices.
Further rotation shifts the figure to reveal a starburst of lines-the 8 ordinary
cubic hyperfaces of a hypercube, which has 24 square faces, 32 edges, and
16 vertices (see Figure 4.5).
A similar grand tour of the hypercube seen in perspective is even more dramatic.
If a hypercube is illuminated from a point lying outside normal,
three-dimensional space, then its three-dimensional shadow looks like a small
glass cube floating within a larger glass cube. As the hypercube rotates,
the inner cube appears to shift, flatten, and turn inside out (see Figure
4.6).
 |
| FIGURE 4.6 Two views of a hypercube rotating in space demonstrate how different the hypercube's three dimensional shadow may look from different angles |
Slices through a cube hint at the hidden riches in store when slices of a
hypercube are viewed. Cross sections of a cube may show up as triangles (when
a corner is lopped off), as squares and assorted other quadrilaterals, and
even as hexagons. In four dimensions, slicing with a three-dimensional knife
produces even stranger shapes: distorted cubes, various prisms, and complex
regular and semiregular polyhedra, often in unexpected arrangements.
Shadows and slices of higher-dimensional objects provide a useful way for
mathematicians to visualize these strange forms. Just as experienced musicians
can look at a musical score and imagine the sounds, mathematicians accustomed
to working with austere equations and stingy notation can read their ordered
symbols and painstakingly construct a mental image of what they have composed.
But the mental image isn't always enough. Vivid
pictures, like brilliant musical performances -
in which the sonorous harmonies and subtle patterns written on paper spring
to life - bring new richness and beauty
to mathematics, which mathematicians and nonmathematicians alike can
appreciate.
One mathematician who has recently spent a great deal of time in the shadowy
world of computer-generated images of four- and higher- dimensional objects
is Thomas Banchoff of Brown University. With computer graphics, he and other
research mathematicians can turn the study of geometric phenomena into an
observational science. To Banchoff, grand tours of visual images suggest
relationships and conjectures that don't arise easily just from equations
or lists of data points. In his words: "You can see things before you
go ahead and prove them."
Banchoff and his colleagues have created several movies that vividly show
off the startling properties of hypercubes, hyperspheres, and other
higher-dimensional forms, and allow mathematicians to explore the curious
properties of these figures. Their insights are useful in mathematical fields
such as differential geometry (minimal surfaces
in higher dimensions and curved spaces), topology,
and data analysis.
The various ways of plotting and manipulating four-dimensional data with
computer graphics are handy tools for many kinds of data analysis. Often,
more than three different types of measurements are necessary to characterize
a physical situation. For example, U. S. Navy personnel are interested in
uncovering the relationship between the temperature, salinity, biomass, and
oceanic current strength at particular points in the ocean so that they can
track sound waves travelling through water. Computer-generated pictures allow
them to search for patterns that help them understand how these various physical
factors are related.
A computer-generated sequence of pictures can also hold a surprising amount
of information. Each tiny dot-called a picture element, or
pixel - on a video monitor has a specific
location that can be specified by two coordinates representing two variables.
That pixel may also have a colour, which could represent a third variable.
Animation adds a fourth dimension, usually time. In this way, an astrophysicist,
say, can view slices of a complex event such as the collision of two neutron
stars, keeping track of the event in a four-dimensional space of position
(two coordinates), density, and time.
Playing with colour and relying on various visual illusions to create the
impression of height and depth add to the number of dimensions or variables
that can be represented in a computer-generated image. That's useful in an
age when researchers often have to cope with many variables and billions
of pieces of data that otherwise would fill reams of computer paper.
