
Much of chaos theory came from trying to understand how the Earth's atmosphere behaves. Now,meteorologists are using chaos to assess how reliable climate and weather forecasts are .
Tim Palmer
EVERY DAY, meteorologists try to predict
next week's weather using immensely complicated mathematical descriptions
of how the atmosphere behaves. Research is also under way to develop models
that will help them make predictions on an even longer timescale, seasonal
forecasts of monsoon rains, for example. Meteorologists would even like to
be able to estimate changes in climate resulting from human activities, such
as the greenhouse effect.
And yet we know that the atmosphere is a chaotic system. As
such, it is inherently unpredictable (see Box). So, are these attempts at
longer-range weather and climate prediction a waste of time? Should we content
ourselves with the television forecast of tomorrow's weather, and leave the
rest to chance?
Although the weather can change every day as individual systems
progress eastwards, depressions and their associated weather fronts, for
example, certain spells of weather can last for weeks, months or even whole
seasons. These spells are not characterised by individual weather systems,
but by the position of the so-called jet streams, regions of strong wind
in the upper atmosphere. They determine whether we will have a wet or dry
summer, mild or severe winter.
Chaos and high winds across the planet
THE SUN'S energy and Newton's laws are responsible for
chaos in the atmosphere. Sunlight warms the tropical regions of the Earth,
whilst over the poles, heat energy is radiated back to space, and there the
atmosphere cools. The atmosphere attempts to pump heat from equator to pole
in as thermodynamically efficient a manner as possible. |
Figure 1 shows the track of the jet stream over the Atlantic
and Europe, which is associated with two different weather "regimes". In
Figure la, the jet stream is more or less oriented along a line of latitude.
Individual weather Systems tend to be steered along the jet stream. Over
the British Isles, this configuration would probably give a rather wet and
unsettled spell of weather, as rain bands pass by with monotonous regularity.
Meteorologists call this a "zonal" regime. In Figure lb, the jet stream splits
into two branches over the mid-Atlantic, with one branch positioned north
of the British Isles, the other to the south. In the summer, this configuration
brings about a warm fine spell of weather over Britain; in the winter, it
produces dull, overcast, and possibly very cold weather. Meteorologists usually
refer to this as a "blocked" regime.
We can define weather regimes quantitatively from historical
records of data of weather in the northern hemisphere, using what are called
"cluster-analysis" techniques. In practice, about 10 different regimes
characterise most of the large-scale variability of the atmosphere in the
northern hemisphere.
Meteorologists have been interested for a long time in the predictability
of these weather regimes. Can we forecast how they evolve up to a month ahead,
even though we can predict what happens to individual weather systems for
only a few days ahead?
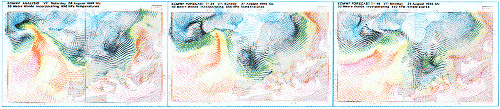 |
| These complex maps from the ECMRWF computer model show predicted weather patterns for six days. Arrows show wind direction and colour (blue: cold; red: warm) shows temperature. |
 |
These sort of problems motivated the
meteorologist Edward Lorenz, whose work at the Massachusetts Institute
of Technology in the early 1960s spawned much of the activity in chaos theory
today. The atmosphere behaves like a turbulent fluid, and Lorenz was only
too aware that it was governed by a set of mathematical equations that were
nonlinear and were extremely sensitive to small changes-in other words, showed
modes of instability. He had an intuitive feeling that this would make weather
prediction a tough problem. To confirm his hunch, he sought a way of simplifying
these equations so that he could study them mathematically, while retaining
their essential nonlinearity and instability.
The most drastically simplified version of the full fluid-dynamical
equations led to a "model climate" with just three variables, x, y and z.
A state of instantaneous "weather" in Lorenz's model can, therefore, be
represented by a point in a three-dimensional
"phase space" and the evolution of
the weather with time can be represented by a line, or trajectory, in this
space (as described in Ian Stewart's article "Portraits of chaos", New Scientist,
4 November). The climate of the model, the set of all possible model weather
states, is known as the Lorenz attractor (see Figure 2).
Figure 1 The position of the jet stream over Europe and the Atlantic in two weather regimes. The first gives rather unsettled weather over the British Isles; the second may give fine warm weather in the summer, dull and possibly severely cold weather in the winter. |
 |
This attractor has no volume in this three-dimensional space,
yet is neither a simple one-dimensional line, nor a smooth two-dimensional
surface. As Ian Stewart's article explains, the attractor has a fractional
dimension (2.06), and therefore, not surprisingly, carries the epithet "strange".
It represents one of a generic class of strange attractors whose topology
characterises the chaotic, unpredictable properties of the basic equations.
Although the three-component equations that Lorenz proposed
do not realistically describe the evolution of weather regimes, they have
similar chaotic properties to more realistic models. So we can use the Lorenz
model to describe in a qualitative way the chaotic behaviour of the evolution
of weather regimes in the atmosphere.
First, notice from Figure 2 that the Lorenz attractor has two separate branches,
sometimes called butterfly wings. We can think
of these wings as representing, in our abstract state space, the two weather
regimes shown in Figure 1 in real space. For the sake of argument, suppose
the left-hand wing corresponds to the zonal regime of Figure la, and the
right hand wing corresponds to the blocked regime of Figure lb. In other
words, any two points on the left-hand wing relate to different instantaneous
weather, but the large-scale flow would be the same.
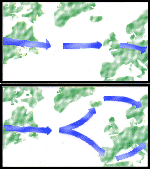
Imagine two points arbitrarily close to each other, on the left-hand
wing of the attractor. Using our conventions, these two points represent
almost identical weather states in a regime characterised by rather unsettled
weather conditions over the British Isles.We now follow the initial evolution
of these two weather states. There are three possibilities: both trajectories
remain on the left-hand wing (see Figure 3a); both trajectories evolve towards
the right-hand wing, as in Figure 3b; or one trajectory remains on the left-hand
wing, while the other moves to the right-hand wing, as in Figure 3c. Note
that in all three cases, the two trajectories have diverged, implying quite
different forecasts of instantaneous weather. On the other hand, in the first
two scenarios (see Figures 3a and 3b), the two trajectories evolve to the
same weather regime (remaining unsettled in the first case; becoming more
settled in the second case).
 |
| Figure 2 The Lorenz attractor in the three-dimensional phase space spanned by the Lorenz model variables x, y, z. |
You can see, therefore, that although the atmosphere is
fundamentally chaotic, you can predict the weather regime from certain initial
conditions in the atmosphere. To find out what these initial conditions are,
we need to make a series of weather forecasts from (a sufficiently large
number of) similar but not identical initial states. Figure 4 shows the evolution
in phase space of two ensembles of realistic weather forecasts over a certain
period. For the first set of initial conditions, in Figure 4a, the forecasts
start to diverge only a little, indicating that the predictability for that
set of initial conditions in the atmosphere is pretty good, so we can confidently
forecast the evolution of weather regime over that period.
On the other hand, in Figure 4b, the paths of evolving weather
patterns from similar initial conditions disperse considerably, indicating
that the atmosphere is in a particularly chaotic state during the period
of the forecasts, so we cannot make any meaningful predictions.
Now, the Lorenz model has only three variables, or three degrees of freedom.
It is much too simple to describe accurately the evolution of the real
atmosphere. In fact, increasing the number of degrees of freedom in models
has improved the quality of weather-prediction for the first few days ahead.
Today's weather-prediction models have about a million degrees of freedom.
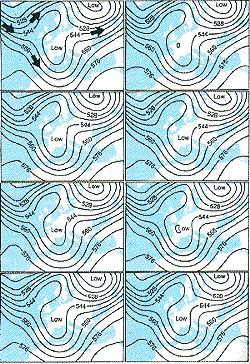
Figures 5 and 6 show an example of an ensemble of eight forecasts
from the weather prediction model we use at the European Centre for Medium-Range
Weather Forecasts (ECMWF). The pictures show contours of the height of a
pressure surface (500 hectopascals) in the middle of the atmosphere. The
wind blows parallel to these contours in the direction shown by the arrows-the
strength of the wind is proportional to the contour gradient. Figure 5 shows
the initial conditions for the eight forecasts. Note that they look very
similar.
Differences between individual members of the ensemble correspond to
uncertainties associated with the weather observing network. The initial
flow in Figure 5 corresponds approximately to the pattern shown in Figure
1; over Britain, the flow is very weak, with the region of strong winds splitting
over the east Atlantic towards the north-east and south-east.
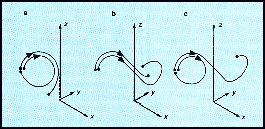 |
| Figure 3 Three trajectories showing the evolution in Lorenz's model atmosphere from almost identical weather states. In a and b, the states evolve similarly; in C, they evolve differently. |
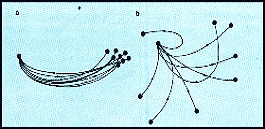 |
| Figure 4 The evolution of an ensemble of forecast trajectories in the phase space of a realistic model for weather prediction. In a, we can give the forecast with confidence, but not so in b. |
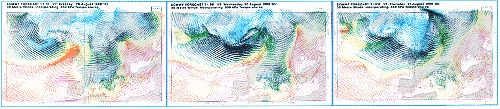
We now run the computer model eight times from each of these
initial conditions and see what the model predicts for the weather one week
later. This is shown in Figure 6. You can see that the forecasts are now
far from identical; their trajectories in phase space (not shown) have begun
to diverge significantly. However, over some parts of Europe, you can see
a weather pattern common to many of the members of the ensemble. Over Italy,
for example, the initial state showed an air flow from the south; after a
week, the winds swing round so that they have a northerly component. So,
an Italian forecaster could confidently predict that Italy should expect
much colder weather a week ahead. Using the ensemble, the forecaster could
estimate probabilities that temperature will fall within certain ranges.
By contrast, the British weather forecaster would have a more
difficult task-the forecasts over Britain diverge much more (confirming the
saying about the unreliability of British 'weather). Nevertheless, it would
not be unreasonable to predict a trend to more westerly flow and unsettled
weather. This example is one that is neither particularly chaotic, nor
exceptionally predictable, and highlights the practical consequences of chaos
for the weather forecaster.
There are many research centres around the world exploring the possibility
of predicting the evolution of weather regimes up to a month ahead. It is
early days in this business, and meteorologists still need to refine their
description of various important physical processes in the computer models.
If they are to forecast weather regimes this far ahead, they will have to
run ensemble forecasts of the sort just described, so as to be able to estimate
how reliable the prediction is. At present, raw computing power is still
insufficient to do this routinely. But with advances in computer technology,
this kind of forecasting may not be many years away.
So far, we have talked about weather in the middle latitudes. In the tropics, the dynamics of the atmosphere is somewhat different, mainly because the Coriolis effect of the Earth's rotation is less dominant. In particular, although there are weather systems in the tropics, such as hurricanes, monsoon depressions and so on, that arise from instabilities of the larger-scale flow, these weather systems do not feed back into the larger-scale flow to the same extent as with weather systems in the middle latitudes. In fact, the behaviour of the large-scale tropical atmosphere is very strongly linked to the temperature of the ocean surface, which evolves over months, rather than days. One well-studied phenomenon that intimately involves the coupled dynamics of the ocean-atmosphere system is the so-called El Niño event, during which ocean temperatures in the tropical east Pacific can rise up to 4 °C above normal during a season. Meteorologists believe that El Niño can influence weather patterns over a substantial fraction of the globe.
It may be feasible to predict flow on a planetary scale in the
tropical atmosphere for a season, using models that take into account the
dynamics of both the atmosphere and the oceans. Certainly there have been
some encouraging successes in forecasting El Niño and its consequences
a season ahead. In a few years' time, weather forecasters may be able to
predict seasonal rain over Africa, India and other tropical countries from
such weather prediction models. However, nonlinearity and instability, the
hallmarks of chaos, are not totally absent in these tropical predictions,
and it is likely that the "multiple-ensemble integrations" which people have
already applied to weather at mid-latitudes will still be a necessary tool
for the tropical forecaster.
 |
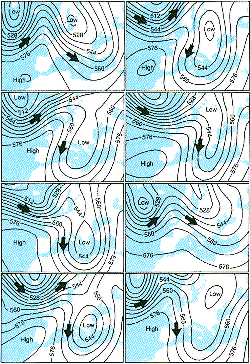 |
| Figure 5 Initial conditions for eight forecasts of the weather prediction model of the European Centre for Medium-Range weather Forecasts.Arrows show the direction of the wind. | Figure 6 Predictions one week later for the eight forecasts. The ensemble shows that we can predict the weather for Italy with more confidence than we can for Britain. |
Finally, does chaos theory prevent us from predicting possible
climate change in the next century? The answer here is no. The type of prediction
is quite different from that outlined above. Here, the goal is not predicting
an individual trajectory on the climate attractor; the goal is to determine
the shape and position of the whole climate attractor itself when, for example,
greenhouse gases increase.
The critical question that climatologists are trying to answer is whether
the climate attractor will suffer a minor perturbation (for example, small
shift of the whole attractor along one of the axes of phase space), or whether
there will be a substantial change in the whole shape and position of the
attractor, leading to some possibly devastating weather states not experienced
in today's climate. Chaos theory certainly does not forbid the possibility
of some substantial change to the atmosphere's climate attractor as a result
of modest increases in the amount of carbon dioxide. At the moment, we cannot
be sure of the answer. The same sort of models employed in predicting the
weather are also being used to try to find out what the greenhouse effect
has in store for us. As with attempts at predicting weather regimes, uncertainty
in climate forecasting is mitigated by the fact that several of the climate
centres around the world now have sophisticated models. Again, researchers
can evaluate their confidence in predicting greenhouse warming in terms of
the dispersion of the ensemble of predictions from these different models.
Nevertheless, chaos dynamics should caution us from making too
premature a judgment about climatic changes. Returning to the Lorenz attractor,
there is no pre-ordained number of times that a given trajectory must circle
around one of the butterfly wings; it could be once, 10 times, or 100 times,
depending on the precise position of the trajectory on the attractor. If
we have a mild winter, a warm summer, then another mild winter, we might
not necessarily be in the throes of man-made climate change; the system might
just be revolving happily around one small part of phase space, and on that
hundred and first revolution, the system might, quite unexpectedly, and for
no apparent reason, evolve towards another part of phase space, which is
associated with cold winters and miserable summers. For this reason, many
meteorologists are quite guarded about whether global warming due to the
greenhouse effect really has arrived.
To the lay person, the unpredictability
of the weather may be a curse; to the meteorologist, it is what makes
the subject fascinating, and fun to study. Above all, chaos does not mean
that we must throw in the towel, and leave all to chance. This blend of
fundamental science with state-of-the-art computer technology is leading
to unparalleled insights into the workings of the fragile gaseous envelope
that surrounds and sustains us.
Tim Palmer is head of the predictability and diagnostics section of the European Centre for Medium-Range Weather Forecasts in Reading, Berkshire.
Further Reading
Predictability in Science and Society, John Mason, Peter
Mathews and J. H. Westcott (editors), Cambridge University Press, 1984;
Topics in Geophysical Fluid Dynamics: atmosphere dynamics, dynamo theory,
and climate dynamics, H. Ghil and S. Childress, Applied Mathematical
Sciences, volume 64, Springer Verlag, 1987. |
Global Warming |
| Chaos | Quantum | Logic | Cosmos | Conscious | Belief | Elect. | Art | Chem. | Maths |