

In the 1970s, population biologists helped to launch the theory of chaos. Now it seems that many aspects of life are probably chaotic. But the problem is that they are also difficult to study .
Robert May
ONE of the most memorable museum exhibits I have ever seen
is in the Smithsonian Museum of Natural History in Washington DC, where the
floor, cupboards and ceiling of a kitchen are covered with the thousands
of cockroaches that would be produced by an average female cockroach if all
her offspring survived. The exhibit vividly illustrates one of the basic
tenets of Darwinian evolution: all animals have the capacity to do
more than replace themselves. But most of the time, a variety of
factors-predators, limited food supplies, disease and a myriad others-hold
the populations in check.
The result is that most populations of plants and animals usually
fluctuate. They tend to increase after dropping to unusually low densities
(at which point, the conditions become most suitable for maximum growth)
and, after reaching unusually high densities, they tend to decrease again.
One of the main aims of ecologists is to discover just what the
"density-dependent" effects regulating populations are. Such understanding
is not only fundamentally important, but it also has practical applications
in trying to predict the likely effects of natural or man-made changes such
as occur when a population is harvested or when climate
patterns alter.
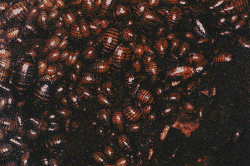 |
| Limits to growth: what stops cockroaches from taking over the Universe? |
Until recently, most ecologists assumed that the effects regulating
density would, in the absence of other factors, keep a population at some
constant level, and that the irregular fluctuations actually seen in so many
natural populations resulted from unpredictable ups and downs in various
environmental influences. So ecologists studying population dynamics saw
their task as trying to extract a steady signal from the masking overlay
of environmental noise.
But in the early 1970s, George Oster at the University of California
in Berkeley, Jim Yorke at the University of Maryland, I and others began
to look more closely at the equations that fish biologists and entomologists
had proposed to describe fluctuations in populations. We found that these
equations show an extraordinary variety of dynamical behaviour, surprisingly
richer than biologists had previously assumed.
Take the equation
which can describe how a population behaves, and whose rich
mathematical character Franco Vivaldi has already discussed in this series
("An experiment with mathematics", 28 October).
Here xt may represent the population of an insect with
the subscript t labelling each successive, discrete generation. Suppose
that each adult in. generation t would produce
l offspring if there is no overcrowding. Then
the population of the next generation, xt be
l xt. The additional factor
(1 - xt ) in the equation represents the feedback from
effects due to density or crowding. The population density is scaled such
that beyond a crowding level x = 1, it goes to zero (that is,
negative values of x correspond to extinction).
Beginning in the early 1970s, these ecological studies have
brought this important equation to centre stage in many scientific disciplines.
When l is less than 1, the population decreases
to zero (for the obvious reason that its reproductive rate is below unity).
When l is greater than 1, but less than 3, the
population settles to the constant value that intuition would suggest. Further
increases in l result in an increasing propensity
for the population to "boom" when its density is low, and "bust" when it
is high.
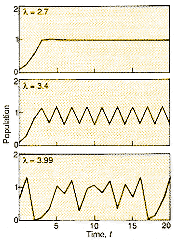 |
Figure 1 Different values of l in our simple equation produce widely differing patterns. In a, the population settles to a constant level; in b, the population alternates between high and low in successive populations; and in c, the population behaves chaotically. |
This increasing tendency to "boom and bust" shows up as positive
feedback (akin to the shrieks from a microphone when the increase in power
level is turned too high) and the population oscillates in a cycle with a
period of two generations, alternating between a high and a low value. As
l continues to increase beyond 3, these cycles
become more complex, with the period lengthening, under successive doublings,
to four generations, then eight, then 16, and soon. The population continues,
however, to alternate between high and low in successive generations. Finally,
when l is bigger than about 3.57, a domain of
apparently random fluctuations appears. This is chaos. The simple
iterative rule now generates population values that look for all the
world like samples from some random process. Figure
1 shows the spectrum of possibilities.
For population biologists, the first message from all this is that the signals from the purely deterministic processes controlling the population density can look like random noise. Even more disconcerting is that, as previous articles in this series have described, in a chaotic system, although the starting values of x might be quite close together, they diverge fairly rapidly, eventually leading to quite different trajectories (see Figure 2). This sensitivity to initial conditions means that long-term prediction is impossible.
Why didn't people recognise earlier these properties of what
is a very simple equation? Several mathematicians had unravelled its mathematical
characteristics, but failed to realise what they implied for the real world.
On the other hand, several ecologists, such as William Ricker who worked
on fisheries at the University of British Columbia and P. A. P. Moran who
worked on insect populations at the Australian National University in Canberra,
had actually studied the equation. They were seeking steady solutions, however,
and having found them they conveniently forgot the chaotic behaviour that
they had also noticed. What happened in the early 1970s is that ecologists
with sufficient mathematical know-how to understand the equations looked
at them in practical settings, so grasping their wider implications.
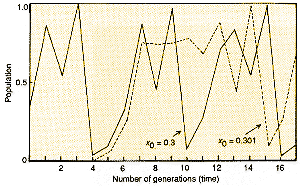 |
| Figure 2 shows how sensitive the growth of a population is to the initial conditions when the dynamics are chaotic. Although the initial values for two populations differ only by 0.3 per cent, their trajectories rapidly diverge. |
To study the dynamics of a population in the light of such
deterministic equations, we must bring our sample species into the laboratory.
Here, we can control the environment and eliminate the complicating effects
of interactions with other populations. The result is a kind of living
computer-useful, but not giving a reliable picture of how the population
really behaves in nature, where other species or environmental changes may
strongly affect the dynamics.
There have been a few such laboratory studies, using quite small
creatures, such as rotifers, Daphnia and blowflies, which have the
advantage that they do not take up too much space and their generations tick
over fairly fast. By raising the temperature, for instance, the experimenter
can speed up metabolic processes so that the fluctuations in population become
more pronouncedly "booming and busty". Such studies have, indeed, behaved
as expected from the equation. But they do not produce the beautifully crisp
period doublings and other phenomena that make the corresponding experiments
on physical systems so compelling.
In the natural world, the job of filtering the information that we want-the density-dependent signals-from superimposed environmental noise is hard enough if the underlying dynamics are steady. But if the signal itself is chaotic, the situation is even more complicated. One powerful method for exploring this problem is to create a computer model, which generates sets of artificial "pseudo-data" representing the size of a population, generation by generation.
In this imaginary world, the investigator can specify all the
factors governing the population's size. The researchers can then analyse
these pseudo-data using the methods normally applied to real data from the
field. In this way, they can judge whether the methods do indeed lay bare
the mechanisms controlling a population's density that were built into the
imaginary world.
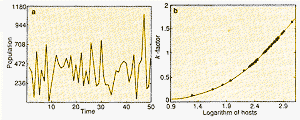 |
| Figure 3a The size of an imaginary insect population,
year by year, as given by a computer model. The variations are due to a mixture
of chaotic dynamics and real noise. Figure 3b: Here, the curve through the points indicates that conventional k-factor analysis can unscramble the signal from the noise, and so detect the effects of insect- population density on the dynamics. |
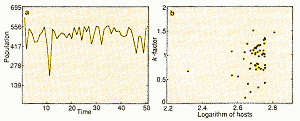 |
| Figure 4a is the same as 3a but includes a random
factor in the number of eggs laid by an adult insect. Again, there is a mixture
of chaotic and genuinely random effects. Figure 4b This time, k-factor analysis just gives a cloud of points. That is, the standard methods of analysis fail to expose the rules governing this imaginary world. |
Michael Hassell of Imperial College, London, for example, employs
rules that encapsulate his ideas about the factors influencing certain insect
populations. In his computer models, adult insects are distributed, according
to rules with some random elements, in many patches, say, on leaves, twigs
or bushes. These adults lay eggs. The probability of ensuing larvae surviving
depends on how crowded they are in each patch; this is the essential
density-dependent factor. Surviving larvae mature into the next generation
of adults, who then spread out into other patches and begin the whole process
anew.
Figure 3a shows one set of such pseudo-data for the overall
population, generation by generation. The fluctuations come partly from random
elements in the process of dispersal (mimicking a natural situation), and
partly as a result of deterministic chaos from density-dependent effects
in crowded patches. Figure 3b shows that analysing the data, with a conventional
procedure called "k-factor" analysis (which aims to reconstruct the underlying
map relating the sizes of populations in successive generations), gives a
simple curve that uncovers how the survival of the larvae does depend on
their density in each patch.
Now, Figure 4a repeats this exercise, but, here, we introduce
environmental randomness into the model by varying the number of eggs laid
by each adult(again,the size of these fluctuations accords with real examples
. As before, the fluctuations in population sizes from generation to generation
come partly from these random factors and partly from deterministic chaos.
But applying the same conventional methods to these pseudo-data reveals no
discernible signal, as shown in Figure 4b. So, although Hassell knows exactly
what governs his world (because he constructed it), the standard techniques
fail to show what is really going on. The basic problem is that once patchiness
in distribution, environmental noise, and chaotic dynamics all interweave,
it can be difficult to disentangle the chaotic, density-dependent signals
from additive noise.
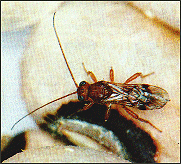 |
| Michael Hassell uses computer models to mimic the population dynamics of real insects, such as C. chinensis |
There is, unfortunately, no punch line to this part of the story.
In the field, chaotic dynamics can create difficulties that we do not fully
understand, and which may require more detailed studies than have been usual
in the past. Another complication, which Oster and I pointed out in 1976,
is that the population we are studying usually interacts with other species,which
in turn interact with others, creating a sort of biological
many-body problem. Such webs of interactions
make chaotic dynamics much more likely. It means that we have to add an extra
variable for each species included in the study, resulting in a multi-dimensional
system of equations of the kind described in previous articles in this series.
So understanding population dynamics then becomes a formidable task.
In these circumstances, William Schaffer at the University
of Arizona, Mark Kot at the University of Tennessee, George Sugihara at the
Scripps Institution of Oceanography in San Diego, and others, have explored
ways of analysing data to see whether the dynamics are truly chaotic. One
approach is to look for mathematical indicators of chaos underlying the dynamics,
such as a "strange attractor" in
multidimensional phase space, as described
in Ian Stewart's article two weeks ago ("Portraits of chaos", 4 November).
We can then try to construct the attractor-without any understanding of the
fundamental biological mechanisms generating it-and set it in the appropriate
dimensions to make it "come into focus".
Taking this approach, Schaffer and Kot looked at cases of measles
in New York City over a 40-year period. They found that, for example, the
string of monthly data, or time series, for the numbers of measles cases
from 1928 to 1968 when vaccination began to alter the dynamics of the
system-revealed a three-dimensional attractor. So-called
"Poincare' cross-sections", or planes
slicing across the attractor, suggest that the dynamics correspond to
deterministic chaos generated by an approximately one-dimensional map, or
an equation of the kind we have already described.
Researchers have analysed these, and other measles data from
Copenhagen, using other methods of detecting chaos. In all cases, the conclusion
is that deterministic chaos best explains the data, although the length of
the time series (at best some 500 monthly points for the New York data) is
too short for a truly reliable analysis by these data-hungry techniques.
This approach of distinguishing between chaos and random noise in population
biology is in its infancy. Even when successful, such methods tell us only
that there are some nonlinear, density-dependent mechanisms operating, but
do not tell us what the mechanisms are. To some ecologists this has an air
of black magic. But I think the approach is useful. It can show us when it
may be profitable to search for such mechanisms and to attempt to make short-term
predictions from apparently noisy data.
You might suspect that you could apply similar kinds of mathematical analysis to other areas of biology where feedback might lead to chaotic changes. You would be right. Chaos may be important for understanding some aspects of how genetic variability is maintained in natural populations. You only have to look around you in the street to see that human beings differ a great deal, for example, in height, weight and facial appearance. How is this variability, or polymorphism, generated and maintained in a species? One way is through natural selection that depends on the relative or absolute abundance of individuals with the same genetic makeup, or genotype, in such a way as to favour rarer genotypes. There are many ecological effects that result in a rarer genotype enjoying a selective advantage. As J. B. S. Haldane first emphasised in 1949, the effects of infectious diseases are particularly important because diseases spread more effectively among more crowded populations. If different genotypes of hosts have differing degrees of resistance to different strains of a pathogen, then the rarest genotypes will enjoy a selective advantage. The reason is that the pathogens afflicting them will spread less effectively, or not at all, because the hosts are more spread out.
This is not an oriental emblem but a "map" of a certain kind of predator-prey system. The horizontal axis is the prey population and the vertical axis is the predator population, as they vary together over time. The fluctuating populations are mainly found in the golden region, with occasional oscillations into the larger crimson domain. |
 |
Until recently, conventional analyses of population genetics showed that
such selective effects could maintain variability within a species, but these
static analyses tended to assume that the proportions of the different genotypes
remained constant overtime. William Hamilton at Oxford, Simon Levin and David
Pimentel at Cornell, Roy Anderson at Imperial College, London, and I have
more recently studied the dynamic properties of the interactions among hosts
and pathogens. The studies show that the proportions of any one genotype
are likely to fluctuate chaotically from generation to generation. Such
chaotically fluctuating polymorphisms are likely to be the rule rather than
the exception.
So far, few biologists have investigated changes in the proportion
of different genotypes present over time in real populations. Karen Forsythe
of the Walter and Eliza Hall Institute of Medical Research in Melbourne has
shown that the predominant strain of malaria in people in New Guinea differs
from village to village, or in the same village over time, in ways that look
chaotic. Studies of patchily distributed populations of plants in the Snowy
Mountains by Jeremy Burdon of CSIRO in Canberra also give enigmatic hints
of chaotic changes in gene frequency.
What is clear is that the selective mechanisms that maintain
genetic diversity within populations can do so at chaotically fluctuating
levels. There is currently much excitement about sequencing what is called
the human genome. Evolutionary biologists have long recognised, however,
that understanding variability within human genomes will be just as exciting.
Chaos could add an extra dimension to this enterprise.
Given the number of biological and environmental factors likely to influence
the dynamics and genetics of natural populations, we might expect to find
more unequivocal examples of chaotic dynamics at the sub-organismal level,
in physiological or neurobiological processes.
Leon Glass and Michael Mackey at McGill University in Montreal
were among the first to explore the possibility that many medical problems
may be what they call "dynamical diseases", produced by changes in physiological
factors that cause normally rhythmic processes to show erratic or chaotic
fluctuations. For instance, in some blood diseases the numbers of blood cells
show large oscillations that are not normally present. Glass and Mackey showed
that simple, but realistic, mathematical models for controlling blood cell
production display the same periodic and chaotic oscillations as seen clinically
when some parameter is varied. Such changes in the parameters of the model
have a physiological interpretation. Clifford Gurney of the University of
Chicago has performed experiments, based on Mackey and Glass's models, which
produce oscillations in numbers of blood cells in mice.
Breakdowns in cardiac rhythms are
obvious candidates for "dynamical diseases". The best studies of the dynamics
of heartbeats, however, come from Petri dishes, not humans. Glass and his
colleagues, Michael Guevara and Alvin Shrier, showed that a cluster of heart
cells from chick embryos will beat spontaneously with an innate and regular
rhythm. Applying a strong electric field to this cell aggregate resets the
phase of the heartbeat; that is, the next beat will be earlier or later than
normal. Introducing a periodic series of such electrical impulses means that
the heart is pushed by two forces with different periods: one with the heart
cells' intrinsic rhythm and the other with the rhythm of the electrical shocks.
The ensuing heartbeat depends on the relation between these two periods.
In some cases, the heart cells resonate with some harmonic of the stimulus, beating once for each jolt, or twice, or perhaps three times for each two jolts, and so on. In other instances, the cells fire apparently at random, giving irregular or chaotic patterns. Glass and his colleagues interpret the dynamics of these periodic or chaotic patterns in terms of the complex bifurcations that result from the interplay between the innate physiological rhythms of heart cells and the frequency of the forcing electrical stimuli. These experiments show that you can induce and study chaos in an artificial system that is a metaphor for cardiac processes. Applying these to cardiac arrhythmias, or to electrocardiograms before and after heart attacks, is, however, still at an early stage.
Neurophysiology also offers a wide range of phenomena that are candidates
for "dynamical diseases", or abnormal oscillations and complex rhythms posing
therapeutic problems. Sometimes, there is a marked oscillation in a neurological
control system that does not normally have a rhythm. Examples are ankle tremor
in patients with corticospinal tract disease, various movement disorders
(Parkinson's tremors, for instance), and the abnormal
paroxysmal oscillations in the discharge of neurons that occur in many seizures.
 |
| Periodic electrical shocks applied to spontaneously beating heart cells from chick embryos (left) can cause the heartbeat to undergo period doubling, as in traces a and b. In trace c, the electrical stimulus produces a chaotic heartbeat. |
Alternatively, there can be qualitative changes in the oscillations
within an already rhythmic process, as in abnormalities in walking, altered
sleep-wake cycles, or rapidly cycling manic depression. Yet again, clinical
events may recur in seemingly random fashion, as in seizures in adult epileptics.
Neural processes are, however, so complex that it is not easy to see how
models for these dynamical diseases-if, indeed, they exist,can be developed,
tested and understood.
One approach, taken by Paul Rapp at the College of Medicine
of the State University of Pennsylvania, rests on analysing the dynamical
complexity of electroencephalograms (EEGs) which recorded the patterns of
brain activity of human subjects as they performed various tasks. Rapp found
that the complexity of the patterns changed in response to changes in
intellectual effort. One study, for example, asked subjects to count backwards
from 700 by sevens. Rapp characterised the changing complexity of the resulting
EEG patterns using what is becoming a standard method for analysing chaotic
rhythmic processes; he computed the fractal dimension of the jagged time
series, and found the dimension rose from its background value of around
2.3 to around 2.9 during the tests. He infers that the higher-dimensional,
more complicated EEG patterns correspond to a more alert state.
If we want to understand the dynamics of neurophysiological
processes more clearly, we need a simpler system that we can control, such
as the light reflex of the pupil of the eye. This reflex is a neural
control mechanism with a delayed negative feedback, which regulates the amount
of light reaching the retina by changing the area of the pupil. You can see
the phenomenon informally by playing with a torch in front of a mirror. If
you want to publish in a scientific journal, however, you would do better
to control the observations by "clamping" the pupil light reflex; the feedback
loop is first "opened" by focusing a light beam onto the centre of the pupil;
the loop is then "closed" by an electronically constructed circuit, or "clamping
box", which relates measured changes in pupil area to changes in the light
shed on the retina. The time delay in the pupil's response, or "pupil latency",
is around 0.3 seconds. As the gain and/or delay in the feedback loop increases,
the pupil light-reflex becomes unstable and starts to oscillate periodically.
In another experiment, where Andre Longtin, John Milton and colleagues (also
at McGill), designed the clamping box to mimic mixed" feedback, the pupil
reflex became unstable and produced aperiodic oscillations. This is due to
the interaction of complex, possibly chaotic, dynamics and neural noise.
These physiological and neurological studies are reminiscent
of those on single populations of animals, in that it is hard to apply theory
to the real situation. Theory and experiment do agree, with varying degrees
of precision, in the laboratory, but these simple, artificial demonstrations
are always open to the cavil that they are no more than animated computer
experiments. Many evolutionary biologists think that chaotic dynamics do
not exist among real populations, because the accompanying fluctuations carry
the risk that subpopulations will wink out, patch by patch, rendering long-term
persistence unlikely. By the same token, earlier work tends to see chaos
as a villain in physiology, manifesting itself in "dynamically diseased"
arrhythmias or seizures.
Ary Goldberger at Harvard Medical School has argued, to the
contrary, that chaos gives the human body the flexibility to respond to different
kinds of stimuli, and in particular that the rhythms of a healthy heart are
chaotic. Goldberger bases his claims on analyses of electrocardiograms of
normal individuals and heart-attack patients. He argues that healthy people
have ECGs with complex irregularities, which vary systematically on timescales
from seconds to days, whereas people about to experience a heart attack have
much simpler heart rhythms. Critics correctly observe, however, that the
broad patterns do not necessarily imply chaos, and that more emphasis should
be put on studying the dynamics of heartbeats and the physical performance
of the heart.
On an even more speculative note, Alisdair Houston at Oxford
has pointed out that there is one context where chaotic unpredictability
certainly could be useful. Organisms seeking to evade a pursuing predator
would benefit from unpredictable patterns of flight behaviour. I believe
it likely that many organisms have evolved simple behavioural rules that
generate chaotically unpredictable patterns of evading predators.
One thing is certain. Biological systems, from communities and
populations to physiological processes, are governed by nonlinear mechanisms.
This means that we must expect to see chaos as often as we see cycles or
steadiness. The message that I urged more than 10 years ago is even more
true today: "not only in [biological] research, but also in the everyday
world of politics and economics, we would all be better off if more people
realised that simple nonlinear systems do not necessarily possess simple
dynamical properties."
Robert May is a Royal Society Research Professor in the zoology department at the University of Oxford and at Imperial College London. Moving from theoretical physics, he is now interested in the dynamics of biological populations, ranging from the structure and diversity of communities of interacting species to the behaviour of insect populations and the epidemiology of HIV-AIDS.
| A NEW WAY OF MEASURING COMPLEXITY for biological systems
has been proposed by researchers at Harvard Medical School and University
of Lisbon (contact Madalena Costa, 617-667-2428, madalena@mimic.bidmc.harvard.edu
, Ary L. Goldberger, 617-667-4267, agoldber@caregroup.harvard.edu and C.-K.
Peng, 617-667-7122, peng@physionet.org). Their method suggests that disease
and aging can be quantified in terms of information
loss. In the researchers' view, a biological
organism's complexity is intimately related to
its adaptability (e.g., can it survive hostile environments on its own?)
and its functionality (e.g., can it do higher
math?). In this view, disease and aging reduce an organism's complexity,
thereby making it less adaptive and more vulnerable to catastrophic events.
But traditional yardsticks sometimes contradict this "complexity-loss" theory
of disease and aging. Such conventional metrics, originally developed for
information science, quantify complexity by determining how much new information
a system can generate. By traditional measures, a diseased heart with a highly
erratic rhythm like atrial fibrillation is more complex than a healthy one.
That's because a diseased heart can generate completely
random variations ("white noise") in its heart
rate. These random variations continually produce "new" information, i.e.,
information that cannot be predicted from the heart's past history. On the
other hand, a healthy heart displays a less-random pattern known as 1/f noise
(see Update 90). The problem, according to the researchers, is that conventional
measures of complexity ignore multiple time scales. To address the inherent
multi-scale nature of biological organisms, the researchers developed a new
"multi-scale entropy" (MSE) tool for calculating
biological complexity. Their technique works like
this: Take a heart rate time series of about 30,000 beats. Then split it
into coarse-grained chunks of 20 heartbeats each and compute the average
heart rate in each chunk. Then measure the heart rate's unpredictability
(its variations from chunk to chunk). More unpredictability means more new
information, and greater complexity. Repeat this complexity calculation numerous
times for different-sized chunks, from 1-19 heartbeats. Such a technique
can reveal the complex arrangement of information over different time scales.
Applied to heartbeat intervals in healthy young
and elderly subjects, patients with severe congestive heart failure, and
patients with atrial fibrillation, the MSE algorithm
consistently gives the fluctuations of healthy hearts a higher complexity
rating than the fluctuations of diseased or aging hearts. (Costa et al.,
Physical Review Letters, 5 August 2002) |
Further Reading
From Clocks to Chaos: The Rhythms of Life, Leon Glass
and Michael Mackey, Princeton University Press, 1988. "When two and two
do not make four: nonlinear phenomena in ecology", Robert May, Proceedings
of the Royal Society, 1986, Volume B228, p 241. Next week:
Carl Murray describes chaos in the Solar
System. |
| Chaos | Quantum | Logic | Cosmos | Conscious | Belief | Elect. | Art | Chem. | Maths |