 |
Shadows from Higher Dimensions
|
Ivars Peterson
A GLOBAL VIEW
From the graceful, flowing forms of minimal surfaces to the starburst of
edges in a hypercube, many striking computer-generated mathematical images
are coming out of exploratory forays into the realm of geometric shapes in
three- and four-dimensional space (three-space and four-space, for short).
A particularly rich source of images is the bizarre world of three-manifolds
in four-space.
When topologists started to explore the world of geometric forms in higher
dimensions, they found that neither the intuition
nor the vocabulary of ordinary geometry was sufficient to describe and
classify the new forms they were discovering. They introduced manifold as
a general term for describing a certain common type of higher-dimensional,
geometric object.
Manifolds are surfaces and shapes, sometimes very complex, that appear to
be euclidean when a small region is examined. On a large scale, however,
these forms fail to follow the rules for a euclidean geometry. Roughly speaking,
the earth's surface is an example of a manifold. To a gardener marking off
a square plot in a field, the earth's curvature is barely noticeable, if
at all. The gardener doesn't have to worry about opposite borders that aren't
quite parallel or corners that aren't quite right angles.
A circle, although it curves through two dimensions, is an example of a one-
dimensional manifold, or one-manifold. A close-up view reveals that any small
segment of the circle is practically indistinguishable from a straight line.
Similarly, a sphere's two-dimensional surface, even though it curves through
three dimensions, is an example of a two- manifold. Seen locally, the surface
appears to be flat.
Picturing a three-manifold is somewhat more difficult. Standing in one spot
and looking around within a three-manifold wouldn't tell an observer much
about the manifold's shape. It would look like ordinary three-dimensional
space. Indeed, just as it's hard to imagine the two-dimensional surface of
a sphere without putting it into three- space, a three-manifold is most easily
viewed from four-space.
The theory of manifolds arose in the nineteenth century out of a need to
understand solutions to sets of equations expressing relationships between
two or more variables. For instance, all the possible solutions to a two-variable
equation can be plotted as a set of points in the plane. Each point represents
a pair of values that make the equation true. Those points typically fall
on a curve. Similarly, the set of solutions to an equation that has three
variables can be plotted as a two-dimensional surface in three-dimensional
space. The points could, for example, fall on the surface of a sphere or
some other two-manifold. For an equation with more than three variables,
the set of solutions may look like a multidimensional manifold embedded in
a space one step higher in dimension than the manifold itself.
It takes considerable mental agility to picture even a simple three-manifold,
such as a three-dimensional sphere. That contorted object can be thought
of as the result of gluing together the skins of two balls so that one sphere
is turned inside out over the other. Astonishingly, the mathematics of
three-manifolds turns out to be exceedingly intricate and more difficult
than the mathematics of manifolds in any other dimension.
The place to start on a trip into this strange world is back in everyday
three-space -the three-dimensional, euclidean space familiar to all of us.
The two-sphere is a convenient starting point. Assigned a radius of 1 unit,
it has a remarkably straightforward algebraic formula:
x12 + x22 +
x32 = 1,where the coordinates
x1, x2, and x3 pinpoint
the location of each point on the sphere with respect to three axes at right
angles to one another.
To be seen, the surface of a sphere ought to be drawn or represented in three-
dimensional space, just as a globe represents the earth's features. But it's
also possible to represent the surface of a sphere in two dimensions: on
a flat surface or on the screen of a video monitor.
Mapmakers do this all the time, having developed
a variety of ways to map continents and oceans onto pages in an atlas.
The standard stereographic projection is one means of achieving the
transformation from a globe's surface onto a flat map. Every point on the
sphere ends up at a particular spot on the planar map. If the north pole
happens to be at the point (0,0,1), that is, one unit up the
x3 axis, then the projection maps every point on the sphere
onto a plane, defined by the x1 and
x2 axes. That plane slices through the globe along its
equator. All the sphere's points, except the north pole, end up somewhere
in the plane (see Figure 4.7).
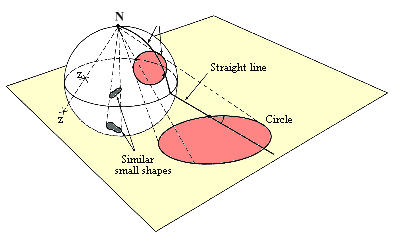 |
| FIGURE 4.7 The stereographic projection of a sphere onto a plane preserves the shapes of some geometric forms and alters others. |
A simple mathematical formula gives every starting point on the sphere its
particular destination on the plane. A point on the globe's equator stays
on the equator, now seen as a circle on the planar map. The point
(3/5, 0, 4/5) in the northern
hemisphere is sent to the spot (3, 0). In fact, every point in that hemisphere
ends up somewhere on the plane outside of the circle marked by the equator.
A point, such as (3/5, 0,
-4/5), in the southern hemisphere goes to a planar
point (1/3, 0), that falls inside the equatorial circle.
In general, each point (x1 , x2,
x3) on the sphere arrives at
[x1/(1-x3),x2/(1-x3)]
in the equatorial plane. The south pole sits at the center (0, 0), while
the north pole is banished to infinity.
Although the resulting map is a decidedly distorted view of the globe, with
every southern point crowded inside a circle and all the northern points
spread out over the rest of the plane, no point on the sphere has been lost
and no points overlap. Structures and patterns visible on a globe appear
in warped but recognizable forms on the resulting map. By carefully studying
what happens to the shape of particular global structures when they are
transferred to a flat surface, mathematicians can learn to deduce or construct
global properties merely by examining features on a flat map. For
four-dimensional objects, which can't be seen directly, mathematicians have
to rely entirely on three-dimensional "maps" to get a sense of their
four-dimensional counterparts.
One way to see what's happening under a stereographic projection is to imagine
a transparent globe on which circles of latitude have been drawn. If a light
is fixed at the usual position of the north pole and the globe's south pole
rests on a flat surface, then the shadow cast by the circles of latitude
is a set of concentric circles. If the globe is tilted while the light stays
fixed in position, the images of the circles shift and become distorted.
Any circles that momentarily happen to pass through the light's position
would cast a fleeting straight-line shadow.
Thus, any circle on the two-sphere reappears as a circle in the plane. The
only exceptions are circles that happen to pass through the north pole. They
project to a straight line. Thus, a set of stripes, all of equal width and
parallel to circles of latitude, would project into a bull's-eye of concentric
rings on the plane. Each ring gets wider as its distance from the center
of the plane, or south pole, increases (see Figure 4.8).
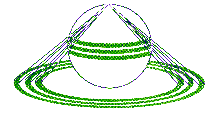 |
| FIGURE 4.8 Projections of bands encircling a sphere onto a plane |
The procedure used to create planar images of the two-sphere can be extended
to generate images of a hypersphere, or three-sphere, as it would appear
in three-dimensional space. The three-sphere in four-dimensional euclidean
space is defined by the equation x12 +
x22 + x32 +
x42 = 1. Compared with the two-sphere, all that's
new is the addition of the coordinate x4.
What does the three-sphere look like? The experience of "A Square" in Flatland
suggests one way to visualize the object. When Flatlanders view a sphere
descending from above into their planar world, they see only the part of
the sphere that intersects their plane. Their first view is of a point, followed
by circles of increasing diameter up to the largest circle, when the sphere's
equator passes through Flatland. Then diminishing circles appear until they
dwindle to a point and vanish. By analogy, a three-dimensional human visited
by a hypersphere would first see a single spot, a tiny sphere, growing steadily
through a sequence of ever larger spheres. Then the spheres would begin to
shrink, at last disappearing altogether.
Projections, such as the four-space equivalent of the stereographic projection,
provide some mathematically more useful glimpses of a hypersphere. One example
of such a projection is the Hopf map, named for German mathematician Heinz
Hopf. This map takes points on the three-sphere and systematically finds
places for them on the two-sphere. Mathematically, each point
(X1, X2, X3,
X4) on the three-sphere becomes the point
(x1, x2, x3) on the
two-sphere, where
| x1 = 2 (X1X2 +
X3X4), x2 = 2 (X1X4 - X2X3), x3 = (X22 + X32) - (X22 + X42) |
Under the Hopf map, every point on the two-sphere represents a circle (called
a Hopf circle) on the three-sphere. Reversing the projection by going from
the two-sphere to the three-sphere, that is, finding the map's inverse, reveals
that a circle of latitude on the two-sphere represents a doughnut-shaped
surface, or torus, in the three-sphere. This is enough to build up a picture
of the hypersphere. Just as two points (representing the north and south
poles) and a series of adjacent bands on a planar map can be used to build
up a complete picture of a two-sphere, two linked circles and a family of
tori make up a full three-sphere. A sliced three-sphere can be imagined as
a sequence of doughnuts within doughnuts, with each successive doughnut swelling
in size as its distance from the center increases (see Figure 4.9).
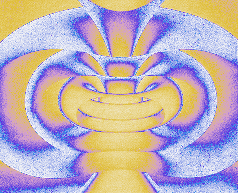 |
| FIGURE 4.9 A view of a hypersphere with its image sliced open to expose its inner structure. |
By manipulating the computer-generated image of a three-sphere, mathematicians
can turn this abstract mathematical object into the star of an animated film
and use it to explore properties of three-manifolds. By tinkering with the
equations that define these objects, they can highlight particular surface
features. They can slice the objects open to get a better view. They can
watch the objects move, linking strings of images to reveal coherent patterns,
such as the smoothly twisted tori that swell up and sweep past one another
when a hypersphere rotates (see Color Plate 4).
Pictures alone, however, don't tell the whole story. The Hopf map itself
was the first example of a special type of projection of points from one
sphere to another sphere of lower dimension. Its existence inspired further
mathematical research in various geometric topics, including the sorting
out of several types of three-manifolds in four-space.
Three-manifolds, such as the hypersphere, show up in applied mathematics
and physics. Different sets of mathematical equations, which may be useful
for describing physical processes as diverse as fluid flow and crystal growth,
generate different curves and shapes in space. The changing behavior
of complex systems over time turns out to correspond neatly to motion on
the curving shapes of certain surfaces. In many instances, understanding
the solutions of particular equations can be turned into a question of
geometry. Although some equation solutions show up as collections of
points on a sphere or a torus, others may reside on a more exotic object,
such as a one-sided, one-edged Möbius strip or
a three-dimensional tube called a Klein bottle,
whose inside surface loops back on itself to merge with the outside.
The hypersphere, for one, makes an appearance in the analysis of motion in
phase space, in which each dimension represents one of the variables in the
equation used to model a particular system. For a mechanical system, the
variables may be just the positions and velocities of each particle in the
system. Beginning at a point representing the initial values of all the
variables, the equation generates a trajectory that winds through phase space.
The location of a point on the trajectory at any time contains all the
information needed to describe the state of the system - that is, the values
of all the variables - at that particular time. Although the motion itself
isn't directly visible, such phase-space
portraits provide a useful collection of information about the motion.
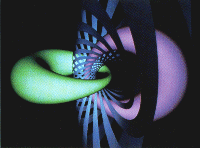 |
Plate 4 Sliced dounuts |
For example, in the motion of a pair of
oscillators, such as two windshield wipers, it takes one variable, the
angle, to define each wiper's position and another variable to define each
wiper's velocity. Together, the positions and velocities of both wipers trace
out a path on the surface of a hypersphere in four-dimensional space. A similar
analysis applies to a pendulum bob fixed to a stiff rod and mounted so that
the bob is physically free to trace out a path on the surface of a sphere.
It takes two coordinates to define the bob's position and two to specify
how quickly it is moving. Tracking the pendulum's path through phase space
- that is, plotting its position and velocity at different times-gives a
graphical history of the pendulum's behavior. Four-space, however, has so
much room that this curving, four- dimensional path could wander almost anywhere.
Luckily, physical constraints - the laws of conservation of energy and momentum
- keep the system within strictly defined bounds. The four-dimensional
phase-space curves are confined to a three-manifold in four-space.
In normal situations, these curves, as seen in four-dimensional phase space.
fall on the surface of a doughnut, or torus. Each torus represents a certain
combination of energy and momentum, equivalent to the initial push given
to a pendulum to get it started. In a hypersphere picture. the Hopf tori
represent the constant "energy- momentum" surfaces, and the Hopf circles
on them are curves representing the changing positions and velocities of
each pendulum (see Figure 4.10). These curves are essentially solutions to
differential equations, called
Hamilton's equations, which define how the motion
changes with time. We take a closer look at the behavior of differential
equations in Chapter 6.
Computer graphics provides a way for researchers to study what the solution
curves look like for various physical systems and sets of initial conditions.
These pictures greatly enrich the study of dynamical systems-the way things
change in time or space.
